Analysis Views
Once you have applied at least 3 filters, the Dashboard will display various views of your filtered cohort. These views are organised as follows:
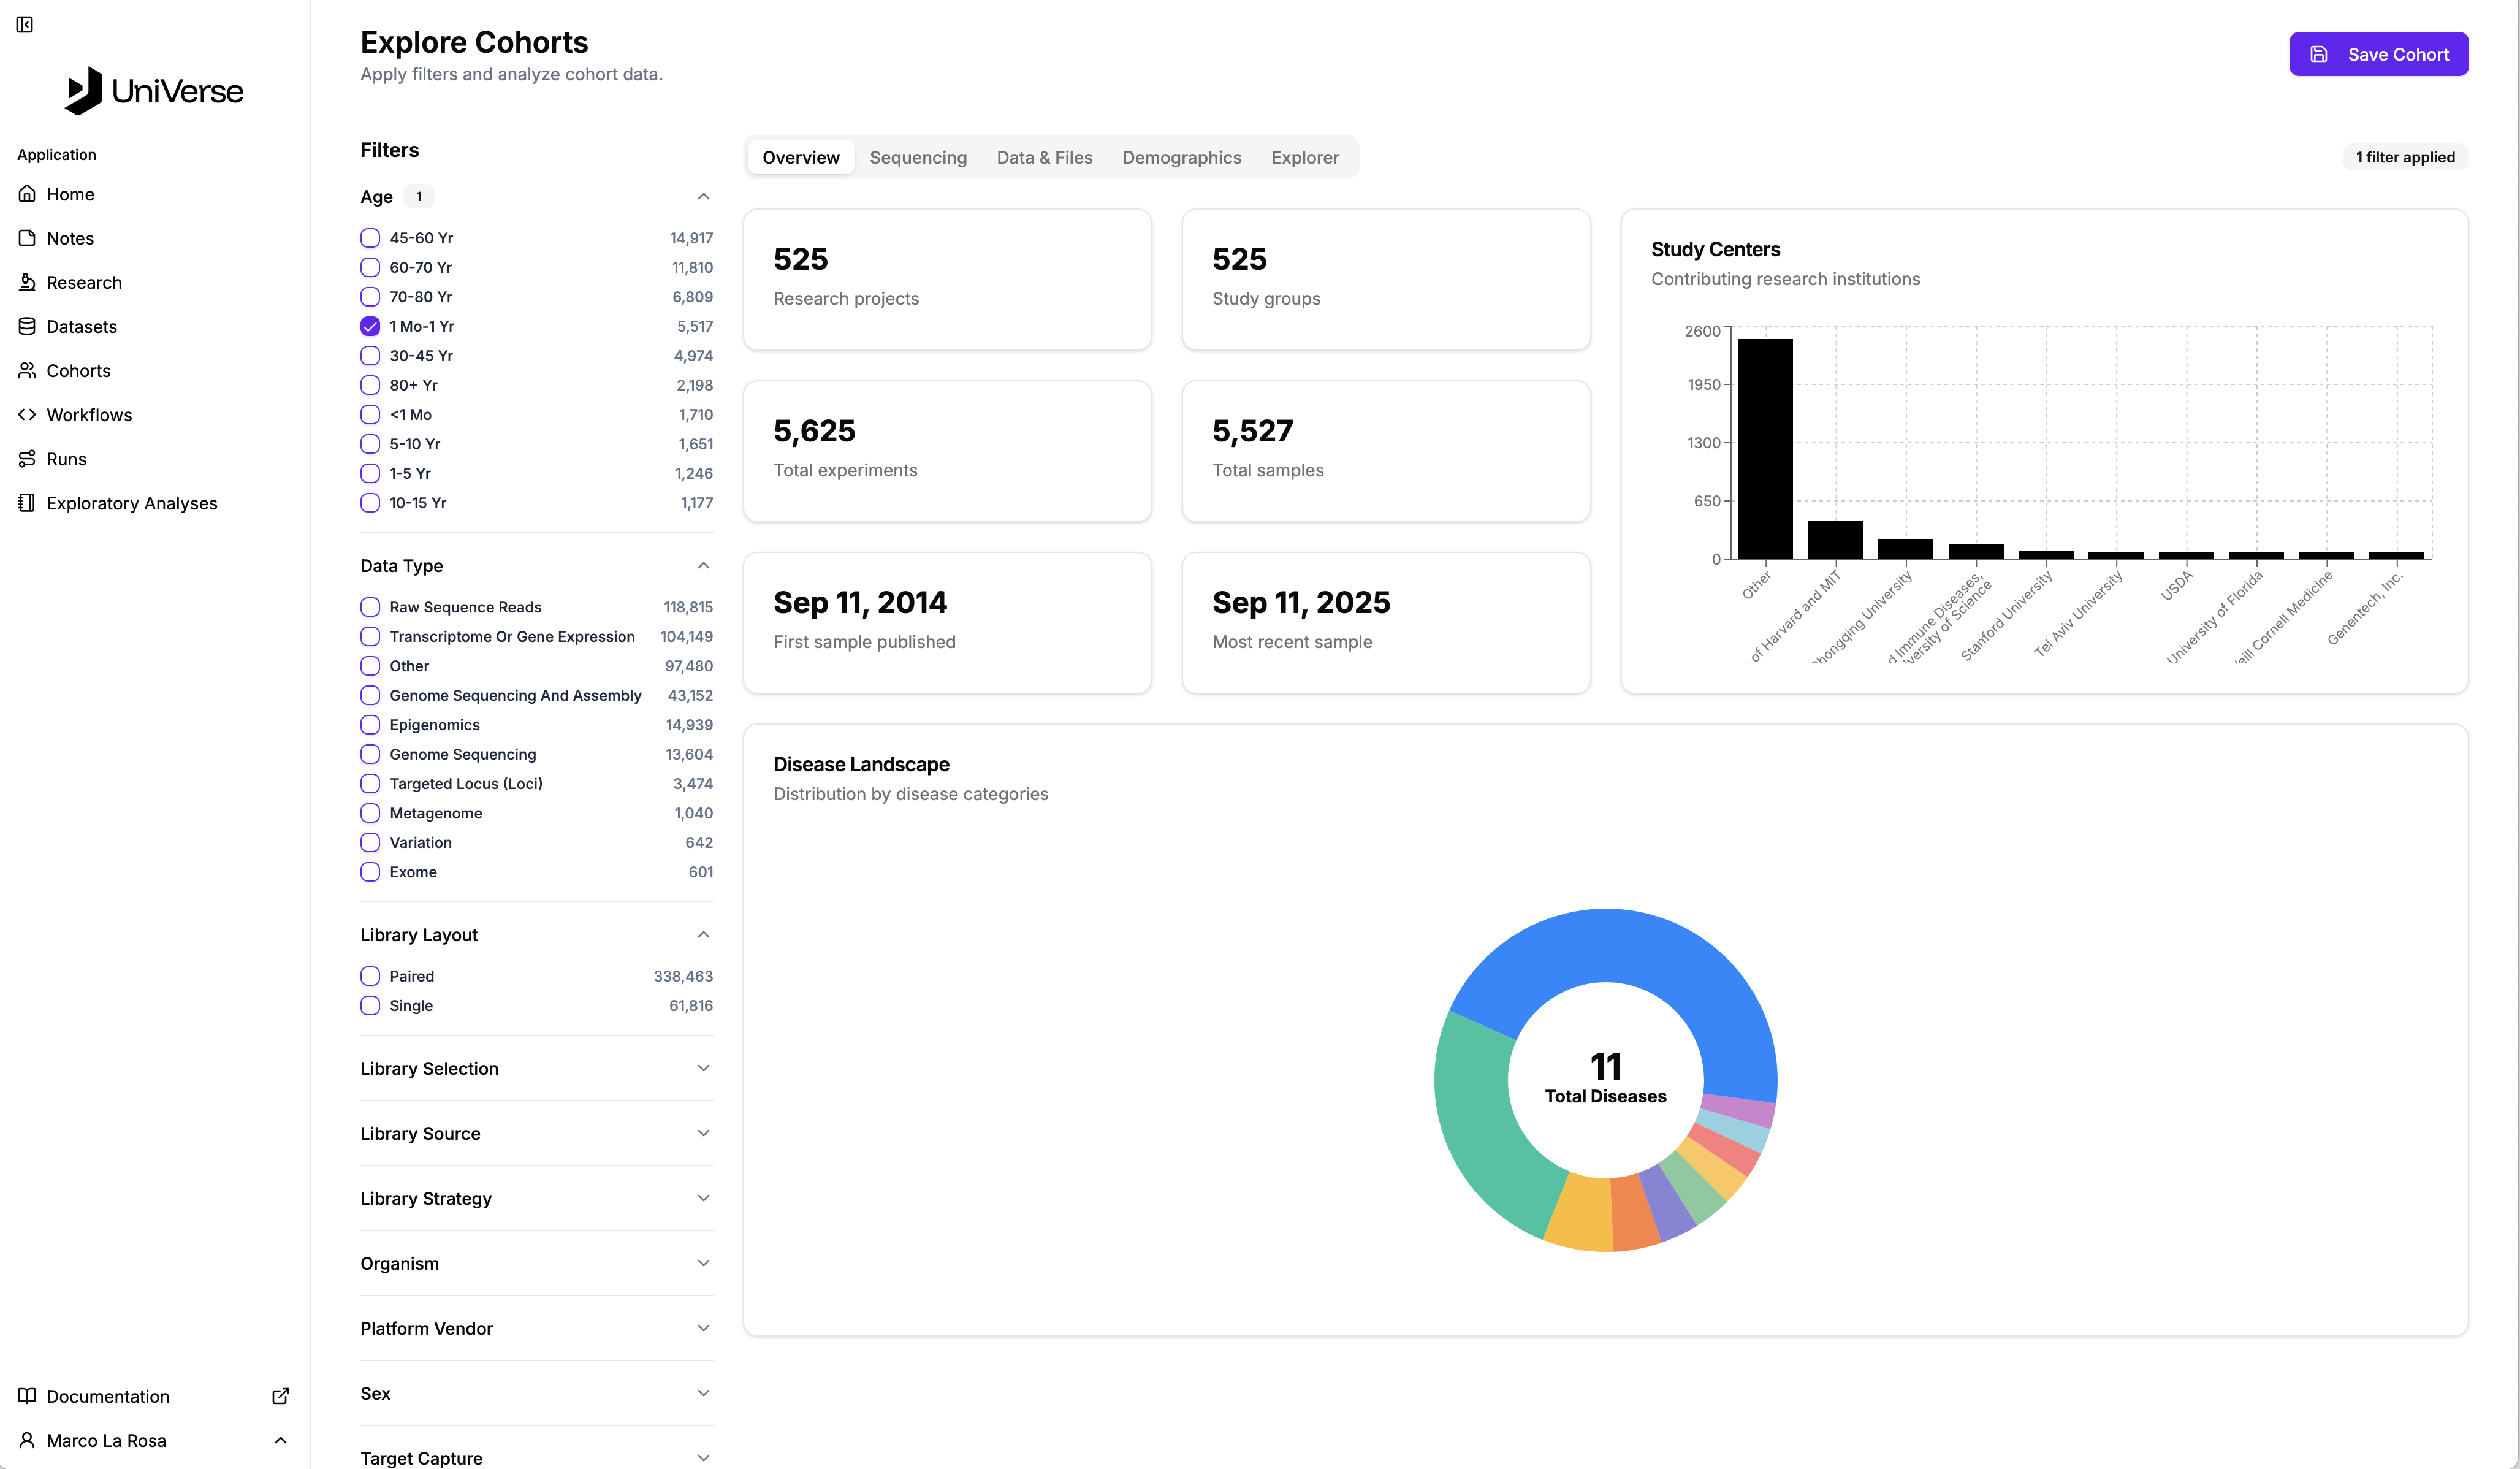
Overview
The Overview tab provides a high-level summary of your cohort, including project counts, study groups, total experiments, and sample details. It offers insights into contributing research institutions and the disease landscape.
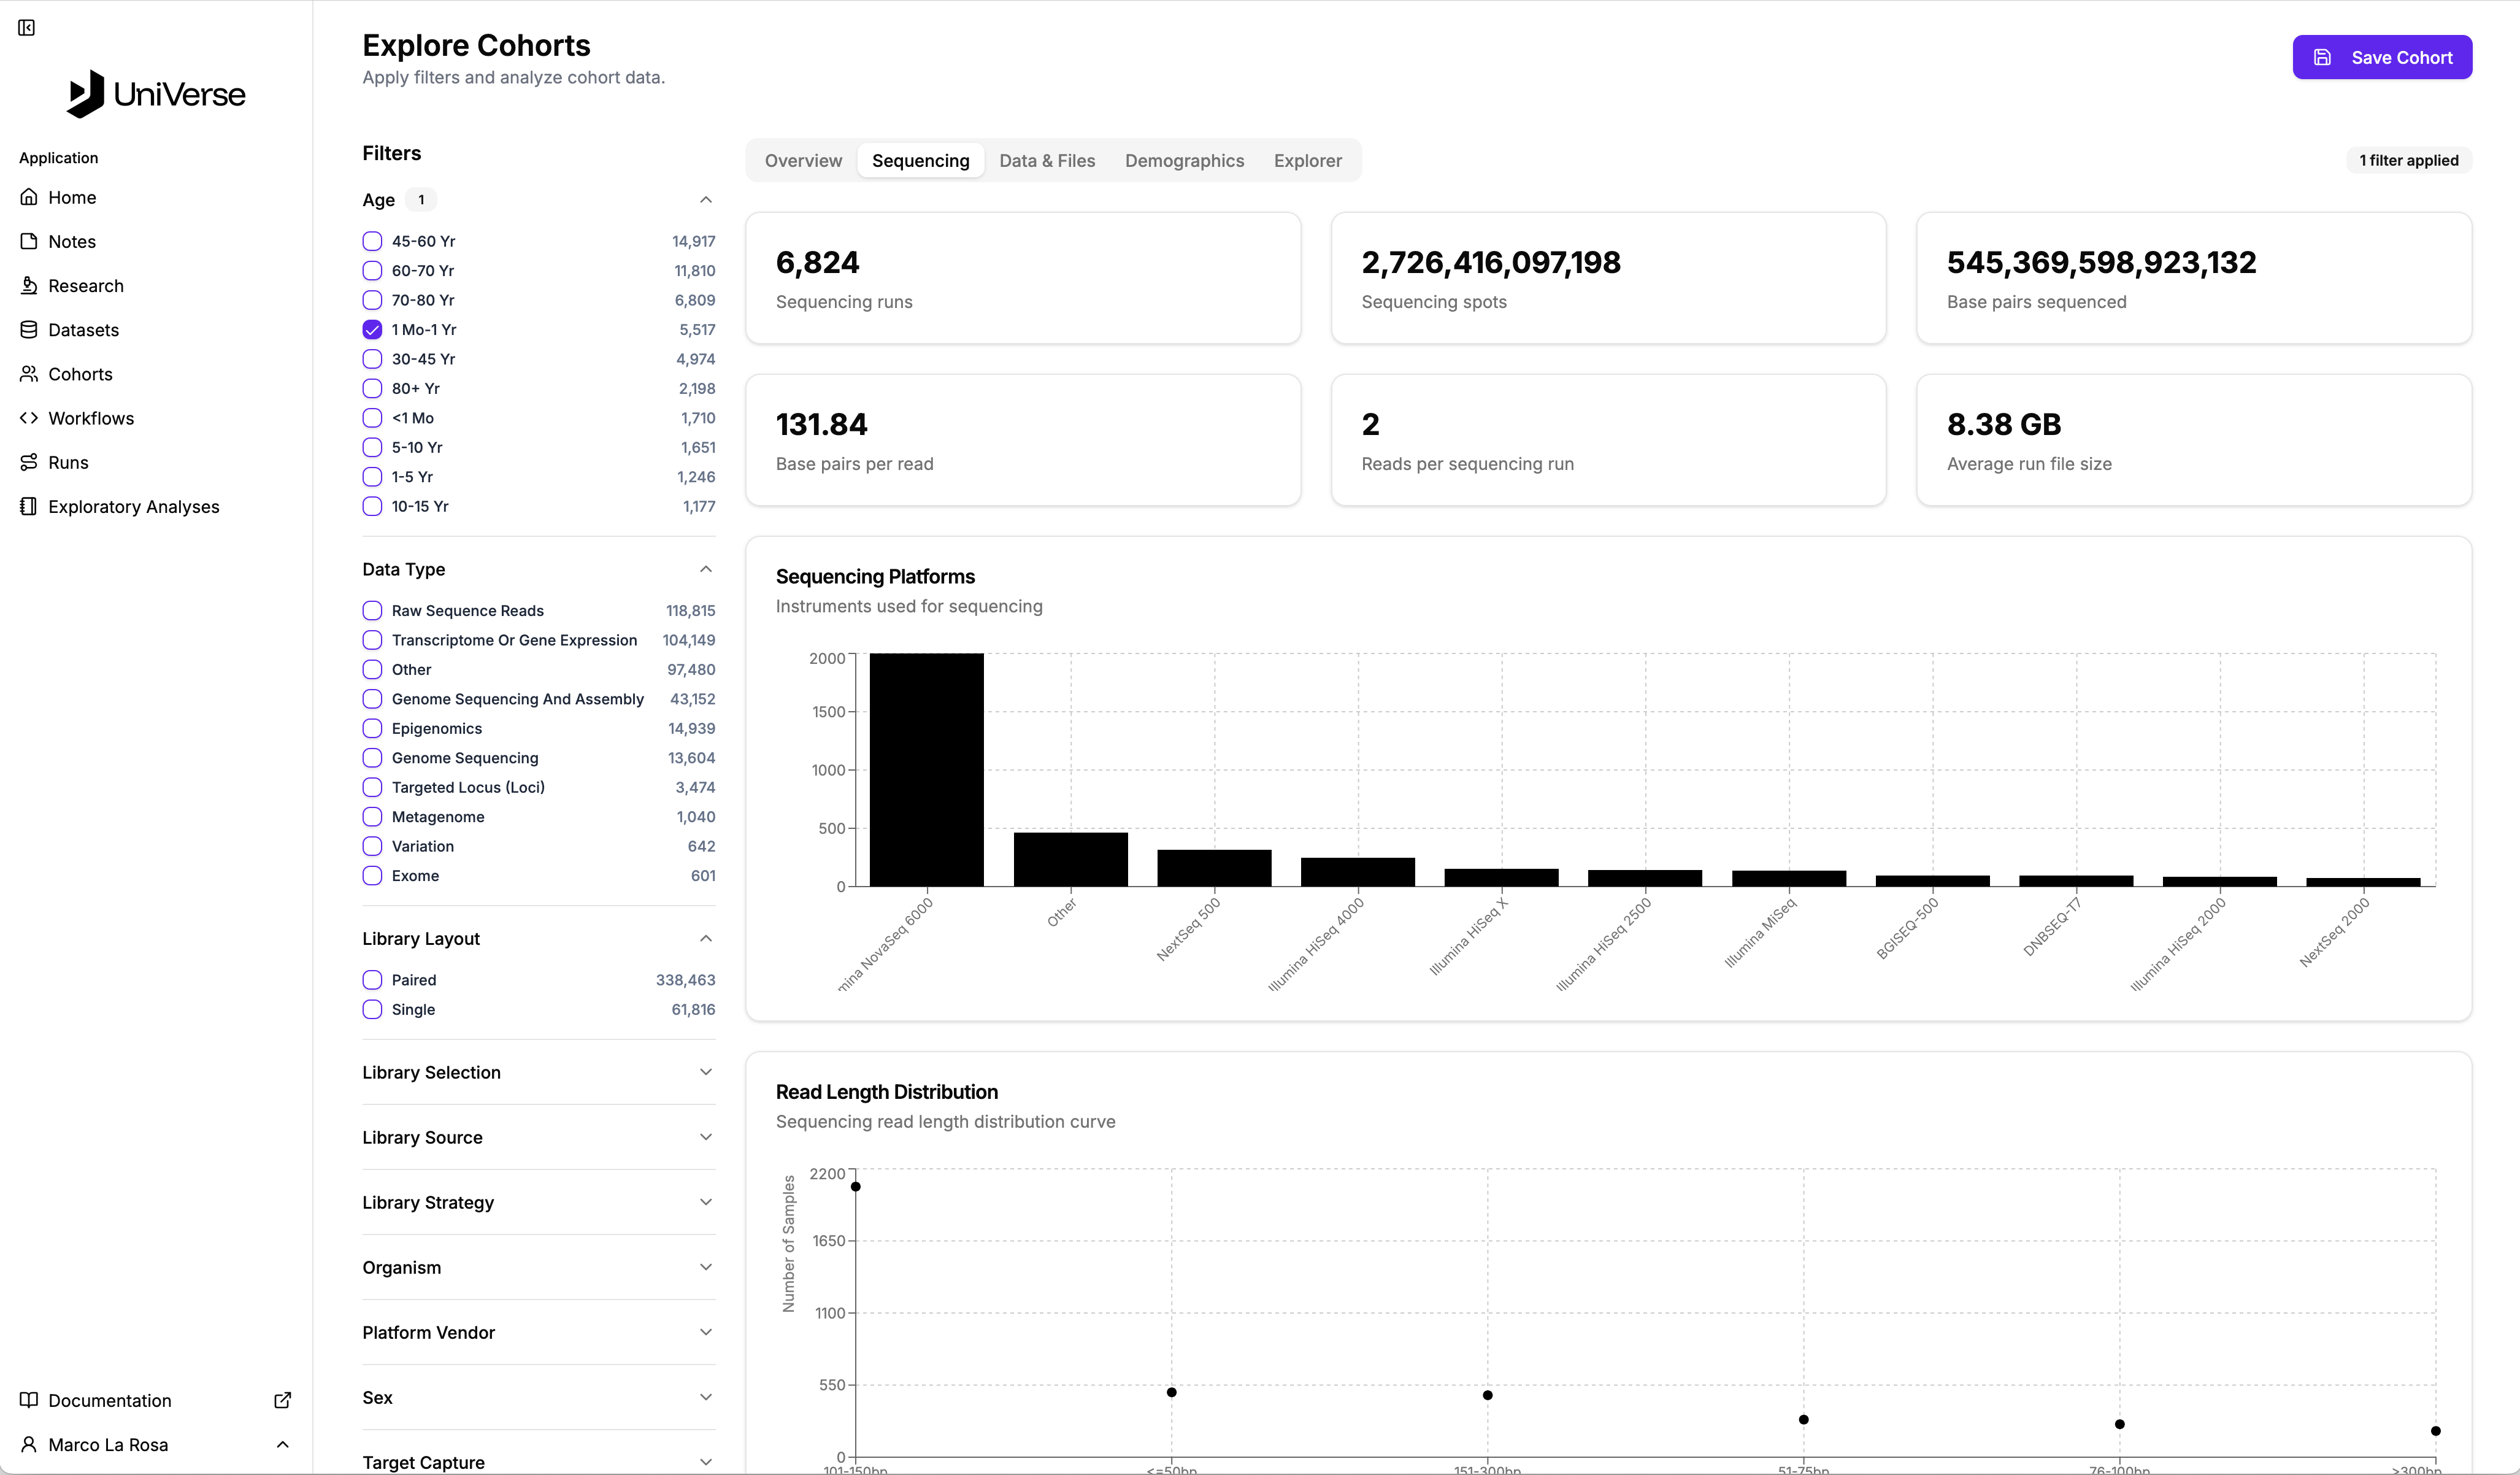
Sequencing
The Sequencing tab presents detailed information related to the sequencing data within your cohort. You can view metrics such as sequencing runs, spots, base pairs sequenced, and average run file size. It also includes distributions of sequencing platforms and read lengths.
Data & Files
The Data & Files tab focuses on the data files associated with your cohort. Here, you'll find statistics on data availability, total data size, and average file size per sample. It also provides a breakdown of file types and data size distribution across different ranges.

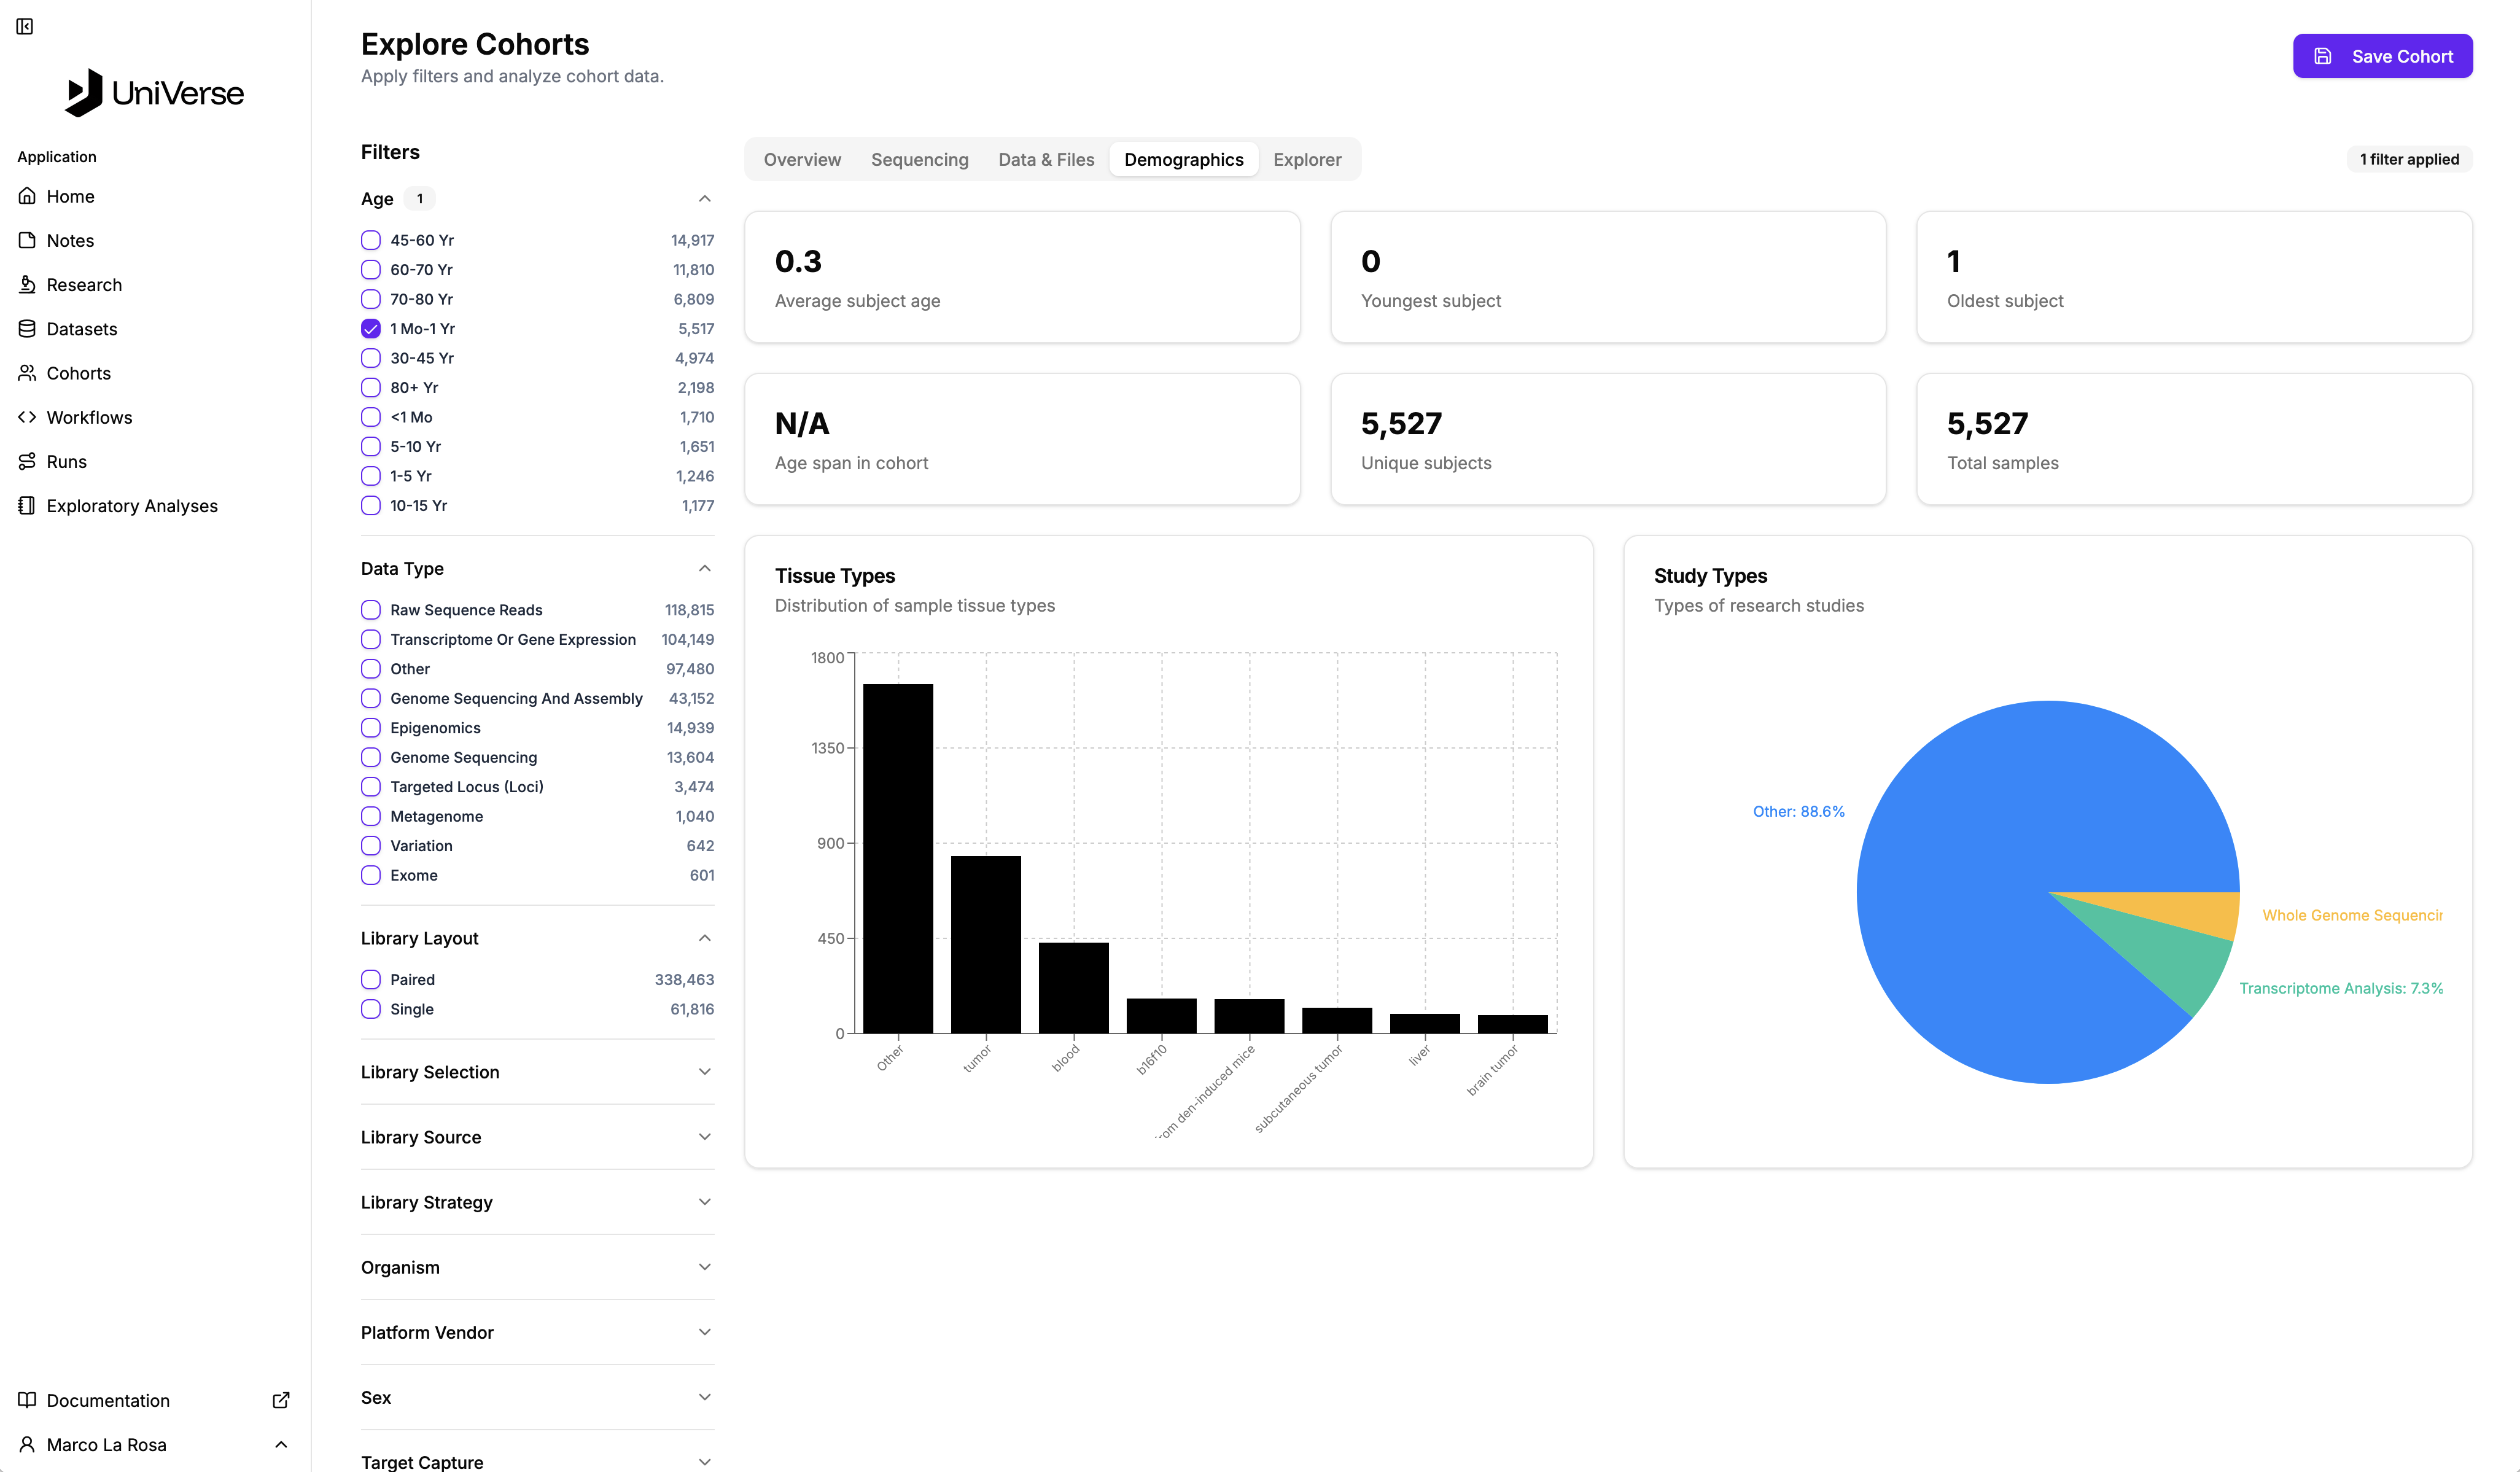
Demographics
The Demographics tab offers insights into the demographic characteristics of the subjects in your cohort. This includes average subject age, youngest and oldest subjects, age span, and the number of unique subjects. Distributions of tissue types and study types are also visualised here.
Explorer
The Explorer tab provides a detailed, tabular view of individual samples within your filtered cohort. You can see specific attributes for each sample, such as Organism, Experiment, Sex, Age, Disease, Library Strategy, and Instrument. This view allows for a granular examination of the data.
